The aim of the research was to examine how climate change would affect the amount of water needed for tomato irrigation. The CROPWAT 8.0 software was utilized to model the total agricultural water usage and irrigation needs for current and upcoming decades. Projections were generated using a MarkSim-Global Climate Model alongside the output for medium (RCP4.5) and high (RCP8.5) emission scenarios. These predictions covered the baseline period (1990-2019) and expected scenarios (2023-2052) and (2053-2082). The results indicated that the water needs for agriculture concerning this crop increased by 3.85% to 7.21% in both scenarios (RCP8.5 and RCP4.5) and timeframes (2023-2052 and 2053-2082). In the high emission scenario (RCP8.5), peak crop water requirements were recorded during the mid-term period, while in the medium emission scenario (RCP4.5), a reduction was observed in the near-term phase. Water needs for crop irrigation varied between 2.48% and 8.15%. The most significant increase occurred with RCP8.5 in the mid-term, while RCP4.5 exhibited the least fluctuation in the near-term. The results indicate that future climate alterations will greatly impact the water and irrigation requirements for agriculture. Farmers, water managers, water user associations, and policymakers are encouraged to collaborate in the future to enhance crop production, water storage, and distribution to increase the currently low efficiency of water utilization.
| Published in | International Journal of Economy, Energy and Environment (Volume 10, Issue 5) |
| DOI | 10.11648/j.ijeee.20251005.11 |
| Page(s) | 134-140 |
| Creative Commons |
This is an Open Access article, distributed under the terms of the Creative Commons Attribution 4.0 International License (http://creativecommons.org/licenses/by/4.0/), which permits unrestricted use, distribution and reproduction in any medium or format, provided the original work is properly cited. |
| Copyright |
Copyright © The Author(s), 2025. Published by Science Publishing Group |
Climate Change, Scenarios for Emissions, Water Needs for Irrigation, Anticipated Irrigation Demand
 =
= 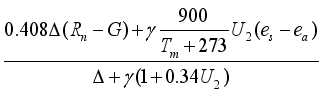 (1)
(1) 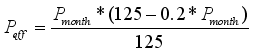 , for Pmonth<= 250 mm(2)
 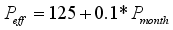 , for Pmonth> 250 mm(3)
  (5)
(5) CROPWAT | Crop Water |
GCM | Global Climate Model |
RCP | Representative Concentration Pathways |
GHG | Greenhouse Gas |
SSA | Sub-Saharan African |
GDP | Gross Domestic Product |
XLSTAT | Statistical Software |
Kc | Crop coefficient |
ETO | Reference Evapotranspiration |
ETC | Crop Evapotranspiration |
IWR | Irrigation Water Requirements |
Pe | Effective Rainfall |
| [1] | H. Birara, R. P. Pandey, and S. K. Mishra, “Trend and variability analysis of rainfall and temperature in the Tana basin region, Ethiopia,” pp. 555–569, 2018, |
| [2] | P. Asare-nuamah and E. Botchway, “Heliyon Understanding climate variability and change: analysis of temperature and rainfall across agroecological zones in Ghana,” vol. 5, no. October 2019, |
| [3] | S. H. Gebrechorkos, S. Hülsmann, and C. Bernhofer, “Long-term trends in rainfall and temperature using high-resolution climate datasets in East Africa,” pp. 1–10, 2019, |
| [4] | E. Girvetz et al., “Future Climate Projections in Africa: Where Are We Headed?” pp. 15–27, 2019, |
| [5] | K. Abera, O. Crespo, J. Seid, and F. Mequanent, “Simulating the impact of climate change on maize production in Ethiopia, East Africa,” Environ. Syst. Res., 2018, |
| [6] | S. Gleixner, N. Keenlyside, E. Viste, and D. Korecha, “The El Niño effect on Ethiopian summer rainfall,” no. May 2016, pp. 1865–1883, 2017, |
| [7] | S. K. Weldearegay and D. G. Tedla, “Impact of climate variability on household food availability in Tigray,” pp. 1–10, 2018, |
| [8] | M. Abera, A. Wale, Y. Abie, and T. Esubalew, “Verification of the Efficiency of Alternate Furrow Irrigation on Amount of Water Productivity and Yield of Onion at Sekota Woreda,” vol. 9, 2020, |
| [9] | S. B. Awulachew and M. Ayana, “Performance OF irrigation: An assessment at different scales in Ethiopia,” Exp. Agric., vol. 47, no. S1, pp. 57–69, 2011, |
| [10] | G. F. Boru and O. Regional, “Impact of climate change on irrigated crop water use of selected major grown crops and water demand for irrigation: A case of Anger sub-basin, Nile basin of Ethiopia,” vol. 4, no. 9, pp. 452–464, 2020, |
| [11] | C. S. Tan and W. D. Reynolds, “Impacts of Recent Climate Trends on Agriculture in Southwestern Ontario,” vol. 1784, 2013, |
| [12] | M. Hanemann and A. Fisher, “Will U. S Agriculture Really Benefit from Global Warming? Accounting for Irrigation in the Hedonic Approach Department of Agricultural and Resource,” no. February 2005, 2014, |
| [13] | FAO, “FAO Irrigation and Drainage Paper Crop by,” no. 56, 2012. |
| [14] | P. G. Jones and P. K. Thornton, “Generating downscaled weather data from a suite of climate models for agricultural modelling applications,” Agric. Syst., vol. 114, pp. 1–5, 2013, |
| [15] | R. G. Allen, L. S. Pereira, D. Raes, M. Smith, and W. Ab, “Crop evapotranspiration - Guidelines for computing crop water requirements - FAO Irrigation and drainage paper 56,” pp. 1–15, 1998. |
| [16] | USDA-SCS, “Part 630 Hydrology National Engineering Handbook Chapter 10 Estimation of Direct Runoff from Storm Rainfall,” Natl. Eng. Handb., 1985. |
| [17] | D. Bekele, T. Alamirew, A. Kebede, G. Zeleke, and A. M. Melesse, “Modeling Climate Change Impact on the Hydrology of Keleta Watershed in the Awash River Basin, Ethiopia,” Environ. Model. Assess., vol. 24, no. 1, pp. 95–107, 2019, |
| [18] | D. Yadeta, A. Kebede, and N. Tessema, “Potential evapotranspiration models evaluation, modelling, and projection under climate scenarios, Kesem sub-basin, Awash River basin, Ethiopia,” Model. Earth Syst. Environ., vol. 6, no. 4, pp. 2165–2176, 2020, |
| [19] | D. Conway and L. Schipper, “Adaptation to Climate Change in Africa: Challenges and Opportunities Identified from Ethiopia,” no. April 2016, 2011, |
| [20] | B. T. Kassie, D. Pioneer, and H. Hengsdijk, “Climate variability and change in the Central Rift Valley of Ethiopia: Challenges for rainfed crop production Climate variability and change in the Central Rift Valley of Ethiopia: challenges for rainfed crop production” no. February, 2013, |
| [21] | N. Tessema, A. K. Kassa, and S. Berhanu, “Impact of climate change on soil water availability and maize water needs in Kesem sub basin, middle Awash, Ethiopia. January 2017. |
| [22] | S. Boonwichai, S. Shrestha, M. S. Babel, S. Weesakul, and A. Datta, “Climate change impacts on irrigation water requirements, crop water productivity and rice yield in the Songkhram River Basin, Thailand,” J. Clean. Prod., 2018, |
| [23] | A. Berhe, H. Shiferaw, and A. Z. Abraha, “Maize and onion: the case of Gum-selasa small-scale irrigation,” J. Drylands, no. April, 2018, |
APA Style
Bedane, H. (2025). Response of Tomato Irrigation Water Needs to Climate Change at Gobu Seyo, Ethiopia. International Journal of Economy, Energy and Environment, 10(5), 134-140. https://doi.org/10.11648/j.ijeee.20251005.11
ACS Style
Bedane, H. Response of Tomato Irrigation Water Needs to Climate Change at Gobu Seyo, Ethiopia. Int. J. Econ. Energy Environ. 2025, 10(5), 134-140. doi: 10.11648/j.ijeee.20251005.11
AMA Style
Bedane H. Response of Tomato Irrigation Water Needs to Climate Change at Gobu Seyo, Ethiopia. Int J Econ Energy Environ. 2025;10(5):134-140. doi: 10.11648/j.ijeee.20251005.11
@article{10.11648/j.ijeee.20251005.11,
  author = {Habtamu Bedane},
  title = {Response of Tomato Irrigation Water Needs to Climate Change at Gobu Seyo, Ethiopia
},
  journal = {International Journal of Economy, Energy and Environment},
  volume = {10},
  number = {5},
  pages = {134-140},
  doi = {10.11648/j.ijeee.20251005.11},
  url = {https://doi.org/10.11648/j.ijeee.20251005.11},
  eprint = {https://article.sciencepublishinggroup.com/pdf/10.11648.j.ijeee.20251005.11},
  abstract = {The aim of the research was to examine how climate change would affect the amount of water needed for tomato irrigation. The CROPWAT 8.0 software was utilized to model the total agricultural water usage and irrigation needs for current and upcoming decades. Projections were generated using a MarkSim-Global Climate Model alongside the output for medium (RCP4.5) and high (RCP8.5) emission scenarios. These predictions covered the baseline period (1990-2019) and expected scenarios (2023-2052) and (2053-2082). The results indicated that the water needs for agriculture concerning this crop increased by 3.85% to 7.21% in both scenarios (RCP8.5 and RCP4.5) and timeframes (2023-2052 and 2053-2082). In the high emission scenario (RCP8.5), peak crop water requirements were recorded during the mid-term period, while in the medium emission scenario (RCP4.5), a reduction was observed in the near-term phase. Water needs for crop irrigation varied between 2.48% and 8.15%. The most significant increase occurred with RCP8.5 in the mid-term, while RCP4.5 exhibited the least fluctuation in the near-term. The results indicate that future climate alterations will greatly impact the water and irrigation requirements for agriculture. Farmers, water managers, water user associations, and policymakers are encouraged to collaborate in the future to enhance crop production, water storage, and distribution to increase the currently low efficiency of water utilization.
},
 year = {2025}
}
TY  - JOUR
T1  - Response of Tomato Irrigation Water Needs to Climate Change at Gobu Seyo, Ethiopia

AU  - Habtamu Bedane
Y1  - 2025/10/31
PY  - 2025
N1  - https://doi.org/10.11648/j.ijeee.20251005.11
DO  - 10.11648/j.ijeee.20251005.11
T2  - International Journal of Economy, Energy and Environment
JF  - International Journal of Economy, Energy and Environment
JO  - International Journal of Economy, Energy and Environment
SP  - 134
EP  - 140
PB  - Science Publishing Group
SN  - 2575-5021
UR  - https://doi.org/10.11648/j.ijeee.20251005.11
AB  - The aim of the research was to examine how climate change would affect the amount of water needed for tomato irrigation. The CROPWAT 8.0 software was utilized to model the total agricultural water usage and irrigation needs for current and upcoming decades. Projections were generated using a MarkSim-Global Climate Model alongside the output for medium (RCP4.5) and high (RCP8.5) emission scenarios. These predictions covered the baseline period (1990-2019) and expected scenarios (2023-2052) and (2053-2082). The results indicated that the water needs for agriculture concerning this crop increased by 3.85% to 7.21% in both scenarios (RCP8.5 and RCP4.5) and timeframes (2023-2052 and 2053-2082). In the high emission scenario (RCP8.5), peak crop water requirements were recorded during the mid-term period, while in the medium emission scenario (RCP4.5), a reduction was observed in the near-term phase. Water needs for crop irrigation varied between 2.48% and 8.15%. The most significant increase occurred with RCP8.5 in the mid-term, while RCP4.5 exhibited the least fluctuation in the near-term. The results indicate that future climate alterations will greatly impact the water and irrigation requirements for agriculture. Farmers, water managers, water user associations, and policymakers are encouraged to collaborate in the future to enhance crop production, water storage, and distribution to increase the currently low efficiency of water utilization.

VL  - 10
IS  - 5
ER  -
Oromia Agricultural Research Institute, Bako Agricultural Engineering Research Center, Bako, Ethiopia
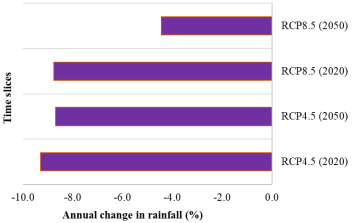
Figure 1. Anticipated variation in yearly precipitation based on future forecasts.
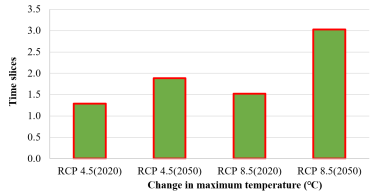
Figure 2. Projected change in annual maximum temperature under future scenarios.
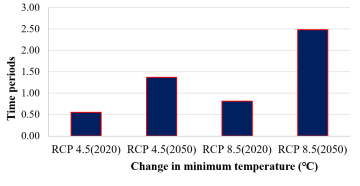
Figure 3. Forecasted variation in yearly minimum temperature under upcoming scenarios.
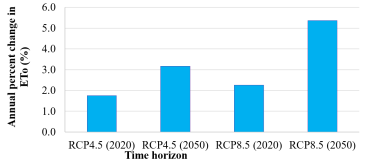
Figure 4. Yearly variation of reference evapotranspiration from the baseline period (1990-2019).
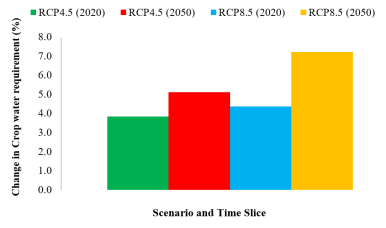
Figure 5. Reaction of tomato crop irrigation needs to climate change.
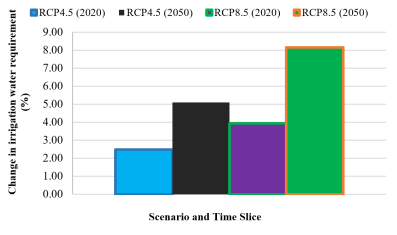
Figure 6. Reaction of tomato water needs for irrigation to climate change.
Information